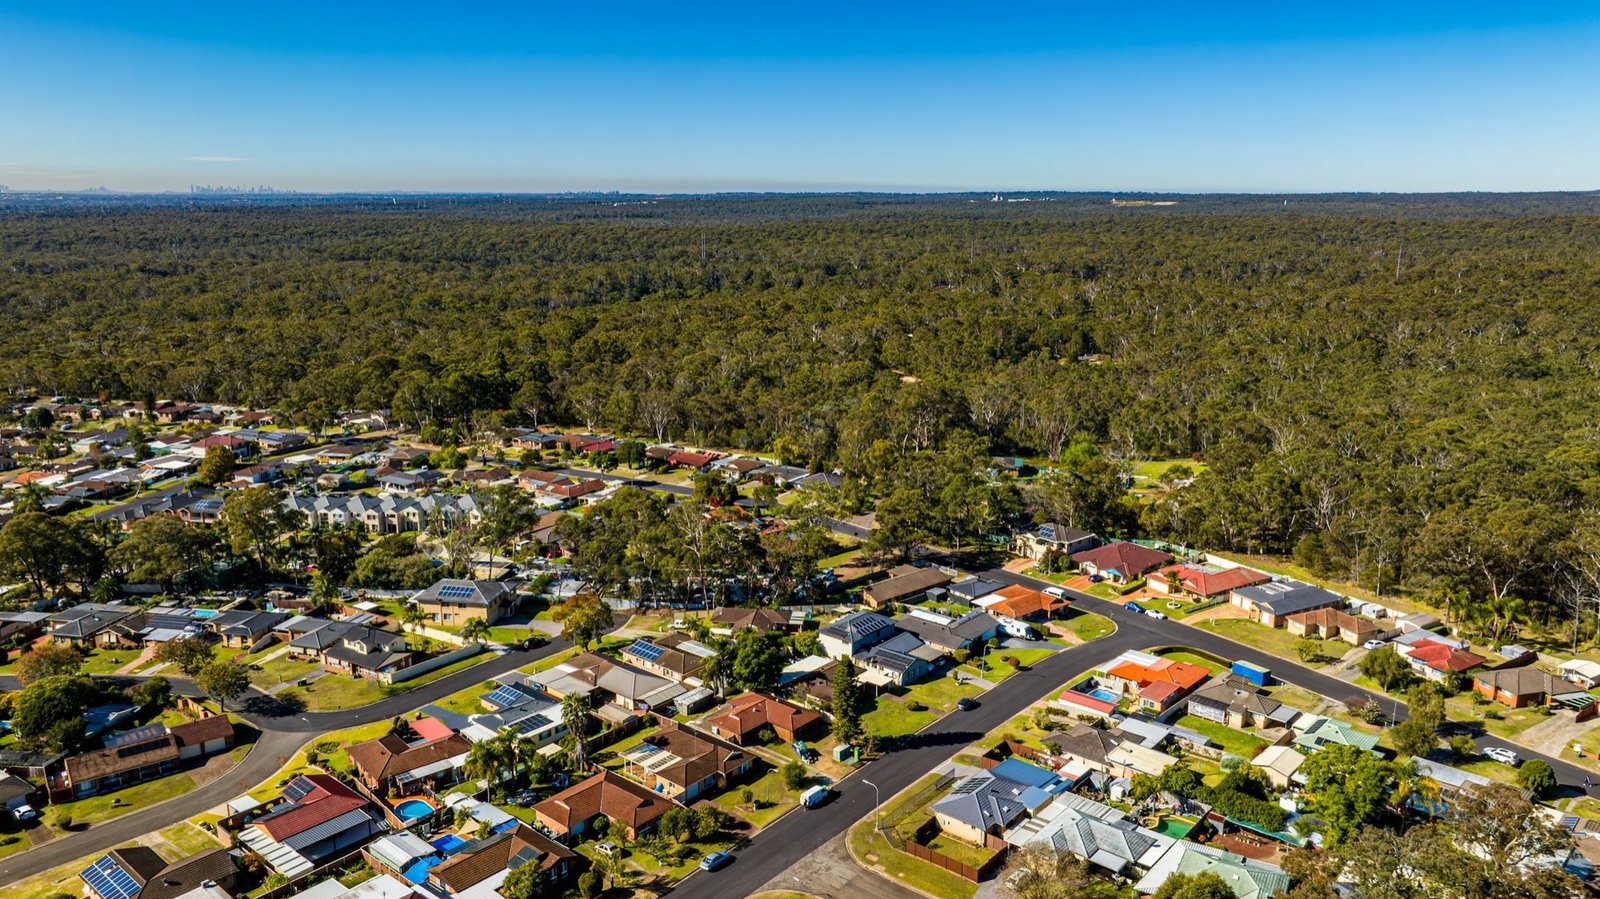
Marsden Park
A north-west growth suburb in the Blacktown area, home to Sydney Business Park, a master planned business estate just off the M7. It has the lowest median house price of the four, at $1,199,000, and the highest gross yield, at 3.8%.

Sydney offers a range of property investment opportunities across different budgets and locations. Here’s what’s happening in the market, which areas are worth considering, and how to assess them against your goals, timeframe and the cost of holding the property.
Who we are
As featured in





Sydney right now
Sydney home values fell 9.4% over the year to October 2026, including a 1.6% fall in October. That left values 10.1% below their February 2026 peak. But the citywide figures hide differences between property types and price ranges.
Houses have fallen further than units. Over the year to October, Sydney house values fell 10.8% and unit values fell 5.6%. Cotality put Sydney's median house value at $1,438,090.
More expensive houses have recorded the largest falls. Cotality's September chart pack shows the most expensive quarter of Sydney houses down 10.7% from peak, compared with approximately 5.4% for the most affordable quarter.
Sales have slowed too, with Sydney sales about 30% lower than a year earlier. A softer market can give buyers more choice and room to negotiate. The opportunity is to buy well and hold for your planned timeframe, with rent and ongoing costs that fit your budget.
Sydney house values: falls from peak
Most expensive and most affordable 25% of houses
Sources: Cotality October Home Value Index (full release) and September Housing Chart Pack. Checked 4 November 2026.
North-west and south-west
These areas offer different combinations of purchase price, rental income and local amenities. All four have median house prices below Sydney's median house value of $1,438,090 (Cotality, October 2026). Compare the numbers, then assess the home against your budget and investment plan.
| Suburb | Median house price | 12-month growth | Gross yield | Days on market | Days to lease |
|---|---|---|---|---|---|
| Marsden ParkNorth-west | $1,199,000 | +4.3% | 3.8% | 46 | 28 |
| Box HillNorth-west | $1,300,000 | +1.0% | 3.6% | 53 | 29 |
| Oran ParkSouth-west | $1,235,000 | +7.7% | 3.5% | 42 | 22 |
| LeppingtonSouth-west | $1,290,000 | +18.9% | 3.5% | 40 | 29 |
PropTrack house figures, November 2025 to October 2026; each suburb name links to its source. Days on market measures selling time; days to lease measures rental advertising time. Both are medians. Gross yield is before costs. Suburb medians cover all houses, not just new homes, and past growth is not a forecast. Sydney's median house value comes from Cotality and is calculated differently, so treat comparisons with it as a guide. Figures checked 4 November 2026.
A north-west growth suburb in the Blacktown area, home to Sydney Business Park, a master planned business estate just off the M7. It has the lowest median house price of the four, at $1,199,000, and the highest gross yield, at 3.8%.
The highest median house price of the four, at $1,300,000, in The Hills area of the north-west. Metro trains run from Tallawong through the city to Sydenham. House prices grew 1.0%, the least of this group, and houses took the longest to sell, at a median 53 days.
A south-western suburb in the Camden area, with health services and shops at The Podium. Houses leased fastest of the four, in a median 22 days, and postcode 2570 had the lowest vacancy of the group at 0.8% in September 2026.
A south-western suburb with its own station on the Inner West and Leppington Line. House prices grew 18.9%, the most of the four, and houses sold fastest, in a median 40 days. Postcode 2179 had the highest vacancy of the group at 6.9% in September 2026.
Rental demand
Houses in these four suburbs took a median 22 to 29 days to lease. Oran Park was quickest at 22 days, followed by Marsden Park at 28. These figures help compare rental demand, alongside the rent achieved and the number of competing homes.
Rental vacancy differs widely across these four suburbs. In September 2026 it ranged from 0.8% in postcode 2570 (Oran Park) to 6.9% in 2179 (Leppington), compared with 1.8% across Sydney (SQM Research). Marsden Park and Box Hill share postcode 2765, where vacancy was 4.1%.
A vacancy rate is the share of rental homes advertised for three weeks or more. One postcode can cover more than one suburb, so these are postcode figures, not suburb figures. Vacancy has risen over the past year in 2179, from 4.8%, and in 2765, from 3.3%. Where vacancy is higher, more similar homes are competing for tenants, so the rent and leasing time you budget for matter more.
For the property you are considering, compare recently leased homes with similar bedrooms, parking and location. Check their rent and time advertised, plus how many similar rentals are still available. New estates and older streets within the same suburb can perform differently.
New homes and the cost of holding
A new home and an established home at the same price can have different holding costs. Rent, maintenance, depreciation and the timing of tax deductions all affect the amount you fund.
New builds can still be negatively geared against wages and other income. For established homes bought after 7:30pm AEST on 12 May 2026, from 1 July 2027 losses can only be offset against residential property income, including capital gains. Unused losses carry forward, and homes held before that time are not affected. Treasury explains the rules.
Use the purchase price, loan, expected rent, property expenses and depreciation for each home. Have a registered tax agent confirm eligibility and calculate the tax outcome. The tax benefit belongs in the comparison alongside the price you pay.
Start with why you are investing
Before choosing a suburb, put a dollar figure and a timeframe behind the goal. How much additional wealth or income are you aiming for? When will you need it? How much can you contribute each week while holding the property?
A property intended to build wealth over 15 years needs a different assessment from one you expect to sell in five. Buying costs, debt, ongoing cash contributions, selling costs and tax all affect what you finish with. A headline capital gain is only one part of that calculation.
Access Wealth assesses properties against its 20 Point Investment Criteria and more than 100 data points. That research starts with the outcome you want and works through to the property, with allowances for vacancies, higher costs and interest rates.
See the full process on How We Work.
Common questions
That depends on your goals, budget and how long you plan to hold the property. Sydney home values fell 9.4% over the year to October 2026, including a 1.6% fall in October (Cotality), with larger falls among more expensive houses. Softer conditions can give buyers more choice and room to negotiate. A worthwhile purchase needs a fair price, evidence of rental demand and ongoing costs that fit your budget.
Sydney’s price falls have not been equal across all locations, property types and price ranges. Cotality’s October 2026 figures show house values down 10.8% over the year and unit values down 5.6%, and its September 2026 research showed larger declines among higher-priced houses. Check recent comparable sales for the suburb and type of home you are considering, rather than applying a citywide headline to every property.
PropTrack figures for November 2025 to October 2026 put median house prices across the four suburbs on this page between $1,199,000 in Marsden Park and $1,300,000 in Box Hill. Cotality put Sydney’s median house value at $1,438,090 in October 2026. The suburb figures are median sale prices and the city figure is a modelled value, so treat the comparison as a guide.
SQM Research put Sydney’s rental vacancy rate at 1.8% in September 2026, up from 1.3% a year earlier. In the postcodes covering the four suburbs on this page, it ranged from 0.8% in 2570 (Oran Park) to 6.9% in 2179 (Leppington). Check how many similar homes are competing for tenants near the property you are looking at.
Start with what you want to achieve, put a dollar figure behind it and set the timeframe. Then work out what you can borrow and comfortably contribute while holding the property. Those numbers shape your property strategy and roadmap. Compare suburbs on price, rent, vacancy and supply, then assess the individual home against that plan.
Free 15-minute Discovery Call
Start with a conversation — 15 minutes to talk through your goals and where you stand today. From there, our team helps you see what the first step toward building wealth through a property portfolio could actually look like. No pressure, no obligation. And if the timing isn't right, we'll tell you.